ISSN: 2977-814X
ISSUE DOI: https://doi.org/10.51596/sijocp.v3i1 Volume 3 Issue 1
Chia-Wen Hsu1, PhD Candidate, Department of Marine Environment and Engineering, College of Marine Science, National Sun Yat-sen University, Kaohsiung, Taiwan
Shiau-Yun Lu2*, Associate Professor, Department of Marine Environment and Engineering, College of Marine Science, National Sun Yat-sen University, Kaohsiung, Taiwan
![]()
Received June 20, 2022
Accepted August 30, 2022
Published Online July 31, 2023
https://doi.org/10.51596/sijocp.v3i1.57
![]()
Abstract
Port and City are two different entities with various development goals. In order to maintain international shipping logistics, port operation needs to increase efficiency and improve surrounding infrastructure, including transportation and connection to the hinterland. Port expansion to sea and/or land is required for shipping development. While ports bring economic growth, they also bring environmental concerns, such as noise, air pollution, deteriorating water quality, etc. On the other hand, cities adjacent to the ports face the dilemma of port development and living quality. From the city’s perspective, decision-makers and elected officials expect not only the improvement of environmental quality but also the freeing of space from a port. When both sides of a port city keep developing and expanding, the interface between the port and the city is a critical area for conflict resolution.
Seven international commercial ports in Taiwan are the focus of this study. Along with the port-city interface, land use types in both port and city are analysed and compared based on GIS spatial models. The result shows that business districts can drive the transformation of adjacent port land use, mainly into open fields or green belts. Comparing the potential environmental impacts from various port operation patterns, residential districts are easily affected by port-related operations. Environmental monitoring data is lower than the legal standard, and the overall quality of living is relatively poor. It’s a huge challenge to achieve port operational efficiency, reduce environmental and social impacts, and bring economic development simultaneously. Decision makers from both port and city need innovative planning and business models to minimise conflicts along the port-city interface. Studying and comparing land-use types among different port cities can provide the information to support decision-making, facilitate negotiation, and reduce conflicts.
Keywords: port-city conflict, port planning, land use, mitigation measures
![]()
Introduction
To meet the needs of international shipping, ports need to expand port space, improve operational efficiency, and improve surrounding infrastructure such as transportation (Notteboom and Rodrigue, 2005). Therefore, the port authorities of commercial ports in Taiwan were reorganised
into port bureaus and a state-owned company (Taiwan International Ports Corporation, TIPC) in March 2012. TIPC is responsible for Taiwan’s commercial ports’ operation and management and integrates the resources of each port to maximise benefits for the central government. However, the ports bring economic growth, but they also have many associated environmental issues, such as noise, air pollution, and water quality deterioration. It is challenging for a port to maintain its own operational efficiency while reducing the negative impact on the community and the environment and bringing economic development to the local area.
Besides, the interface between the port and the city is regarded as an urban expandable area, which makes it easy for the stakeholders of different positions of the port and the city to come into conflict (Hein & Van Mil, 2019). With the expansion of the city, the leaders of local governments or representatives of public opinion hope that the area adjacent to the port can improve the environmental quality, release port space for the people, and plan uses of the port that is not related to its development to promote the economic development of the city (Ng and Pallis, 2007).
In Taiwan, TIPC gives unique function positioning to each port to avoid homogeneous competition, but also has to consider the needs of local port-related industries and local governments (Daamen, 2007). The mixed-use of the port interface must take into account the needs of the city and provide functions such as housing, sightseeing, and hydrophilicity, but still needs to maintain the original functions of the port, such as ship berthing, cargo transportation, logistics storage and transportation, etc. (Verhoeven & Backx, 2010). Port operators must consider innovative business models, such as multipurpose use of port land or take measures to reduce environmental conflict.
This study analyses the land use types at the port-cities interface in Taiwan to understand how city planning and port development interact with each other. It tries to build the models that drive land use change and environmental change in the port cities and find the mitigation measures proposed between ports and cities to minimise their impacts on each other.
Methodology
Research sites
Taiwan is located in East Asia, and international trade was prosperous in the early days. The Port of Kaohsiung once reached the third largest port in the world. However, due to competition from coastal ports in China, in recent years, there has been a downward trend in throughput. As a result, the interaction of port cities began to change.
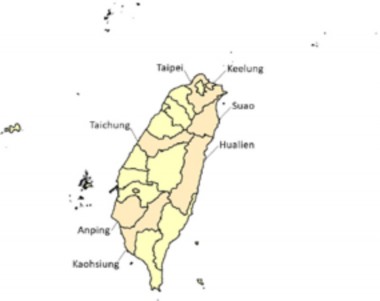
Figure 1. Seven international commercial ports in Taiwan (Made by author)
Seven international commercial ports and corresponding cities in Taiwan are the research sites, and this study tries to find a relationship between the land use types of the port cities.
Statistical data
Some phenomena can be observed from the throughput of each port and the corresponding cities’ area and population. Table 1 shows that the Port of Kaohsiung is the largest port in Taiwan by throughput and was ranked the 15th largest port in the world in 2021. Container handling volume is also the highest among Taiwan ports, with more than 50% of re-export containers handled. The Port of Taichung and the Port of Taipei are both artificial ports, mainly for the development of logistics and warehousing industries. They have promoted the offshore wind power industry in recent years, so throughput continues to rise. As the remaining ports are affected by international port competition and domestic economic impacts, throughput slightly decreased.
Table 1. Taiwan port cities with cargo and container traffic in 2021 (Author Summary)
Ports | Cargo thoughts (Tons) | Container handled (TEUs) | Port Areas (water+ land) (km2) | Type | Population | Areas (km2) | Population density |
Keelung | 16,587,193 | 1,601,371.75 | 4.13+1.96 | Urban | 363,977 | 132.76 | 2,742 |
Taipei | 20,733,274 | 2,009,132.25 | 26.32+4.59 | Urban | 4,008,113 | 2,052.57 | 1,953 |
Suao | 4,208,947 | 0.00 | 2.79+1.27 | County | 450,692 | 2,143.63 | 210 |
Taichung | 73,248,492 | 1,979,221.50 | 83.81+29.04 | Urban | 2,813,490 | 2,214.90 | 1,270 |
Anping | 1,987,039 | 381.00 | 15.65+2.39 | Urban | 1,862,059 | 2,191.65 | 850 |
Kaohsiung | 120,120,722 | 9,864,447.50 | 158.65+18.71 | Urban | 2,744,691 | 2,951.85 | 930 |
Hualien | 9,012,681 | 0.00 | 13.10+1.59 | County | 321,358 | 4,628.57 | 69 |
Comparing the city information where the ports are located, it can be found that the Port of Suao and Port of Hualien are situated at a lower urban level, population density is lower than that of other ports, and port operations volume is also less than other ports. The Port of Keelung is located in the highest population density, but the port area is smaller than others, and throughput is high. From this, it can be found that the pressure between the city and the port can be expected to be high in the Port of Keelung.
Sources of planning layers
This study compares the land use types between city planning and port planning. In Taiwan, there is an Urban Planning law that guides the planned development of important facilities related to city life, such as economy, transportation, health, security, national defence, culture and education, and recreation in a particular area. However, it does not mean that the actual land use situation will be consistent with the planning content, especially when land use types existed before the planning. It only means that when land is to be used in the future, it must be implemented in accordance with the land use types of the planning content.
Port planning is also implemented in accordance with the Commercial Port Law, which plans the development and construction projects of the port for the next five years and reviews them annually. As port planning focuses on the development of commercial ports, the industry is dominated by shipping, transportation and logistics. However, city planning focuses on economic growth and quality of life, and industry is mainly based on tourism and cultural creation. The different planning directions of ports and cities lead to conflicts in land use types.
Analysis tools
We used ArcGIS Pro to analyse and compare the land use types in port and city planning, trying to find a correlation between different land use patterns.
Analysis Results
Business districts drive ports to open in public
The comparison of land use between port planning and city planning in the seven subject port cities shows that the division between the port and city is dominated by roads (Figure 2 and Table 2).
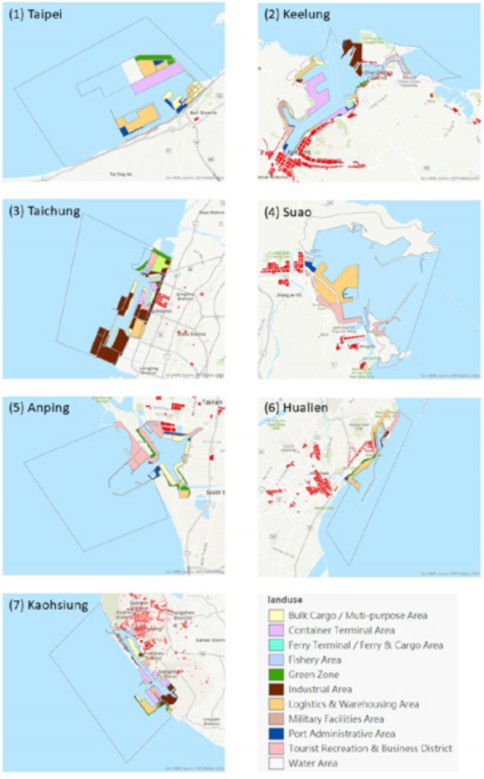
Figure 2. The land use of Taiwan ports and business districts (red colour) of urban planning (Made by author)
When the city’s business district is adjacent to the port, the intermediate land use type is transformed into a buffer pattern, such as tourist recreation or green belt. However, most of the buffer locations are land in the port area rather than land in the city area, such as the Port of Taichung, Port of Anping, Port of Kaohsiung, Port of Hualien, and Port of Suao. Those spaces are mainly for the development of sightseeing and recreation or green belt parks. As for Kaohsiung City, part of the buffer zone (green belt) is located in the city, but it is directly adjacent to the waterfront of the port area and has no impact on the operation of the port area. Besides, the buffer zone between the city’s business district and the port area (Port of Taipei) of New Taipei City is also located in the urban area, and there are green belts between the port area and the city’s industries. Therefore, it can be inferred that if the city space is sufficient, the buffer zone will be planned on the city side adjacent to the port area. However, when the city area cannot adjust the land use pattern to become a buffer zone, the land use pattern of the port area is mostly changed to become a buffer zone.
Table 2. Land use in the port area and adjacent business districts of city planning (Author Summary)
Port area | Adjacent business districts of city planning | The demand of land release | |
Port | Land use types | Average interval distance (Land use types) | |
Keelung | Passenger, Cargo and Container Terminal | 30m (vehicle road) - business district | high (regulated area) |
Taipei | Automotive logistics, oil storage tank | 100m (Green Belt) - 150m (Industrial District) -100m (Green Belt) - Business District | low |
Suao | Administrative area | 35m (Vehicle Road) - Business District | high (regulated area) |
Taichung | Forest Park | 70m (Vehicle Road) - Business District | high (non-regulated area) |
Anping | Yacht marina | 35m (Vehicle Road) - Business District | high (non-regulated area) |
Kaohsiung | Green Belt, Passenger transportation center | 20m~35m (Vehicle Road) - Business District or 90m (Green belt) - Business District | high (non-regulated area) |
Hualien | Green Belt | 30m (Vehicle Road) - Business District | low (non-regulated area) |
Poor life quality - Noise
The operation types of the port can be roughly divided into containers, general cargo, bulk cargo, liquid cargo, passengers, etc. On international shipping routes to Taiwan, most of the containers and bulk carriers arrive in the middle of the night. The loading and unloading operations of these goods are prone to excessive noise in the evening and at night. According to the Amendment to Noise Control Standards for noise control area delimitation, port land is classified as Class 4 Control Zone, city residential areas are classified as Class 2 Control Zone, and others are classified as Class 3 Control Zone.
If we look at the concept of space, according to the “inverse square law”, the sound intensity will decrease with the square of the distance. According to this law, the volume of the sound source decreases by 6 dB for each doubling of distance. This concept is applied to noise control zones; if the Class 4 Control Zone emits 65 dB at night, the Class 3 Control Zone needs to be more than 3 m away to maintain the standard value of 55 dB. The Class 2 Control Zone needs to be more than 6 m away from the Class 4 Control Zone to maintain the standard value of 50 dB.
In addition, the regulations stipulate that if the road is the Class 4 Control Zone and within 15 m away from the road, it is the Class 3 Control Zone. When the noise happens, it is basically less likely to exceed the legal limit. If the Class 4 Control Zone exceeds the regulation (for example, 70 dB), according to this formula, the Class 2 Control Zone should be more than 12 m away from the Class 4 Control Zone, so the regulations stipulate that within 15 m is sufficient for residential areas to be the buffer space. However, the business districts adjacent to the port area are mostly mixed residential and commercial areas. The road adjacent to the residential district should be the Class 2 Control Zone, but houses within 15 m away from the roadside are all classified as
the Class 3 Control Zone. Hence, the living environment is also relatively noisy. Therefore, the residents cannot meet the living standards of the Class 2 Control Zone (Table 3).
Table 3. General regional volume standard value (unit: dB) (Author Summary)
Class 4 Control Zone | Class 3 Control Zone | Class 2 Control Zone | Class 1 Control Zone | |
Daytime (07:00-19:00) | 75 | 65 | 60 | 55 |
Evening (19:00-23:00) | 70 | 60 | 55 | 50 |
Nighttime (23:00-07:00) | 65 | 55 | 50 | 45 |
Recommended space distance | 0-2 m | 2-4 m | 4-8 m | 8-16 m |
Regulatory space distance | 0 m | 15 m | - | - |
Mitigation Measures
Flexible use of port facilities
From the above study, it can be found that to meet the needs of city development, most of the land in the adjacent business districts of the port area has been converted into tourism, recreation or green belt parks. However, ports have basic operating space requirements, and not every port can release space, such as the Port of Keelung. There is a wide range of areas in the port adjacent to the business district in the city. If all of them are converted into the types which assist city development, it will affect the port operation of Port of Keelung. Therefore, the local government and the port operating unit need to communicate with each other. Whether they choose to release the inner port space or design facilities with tourism functions and commercial use, they need to plan gradually.
Recently, there has been a case of flexible use of port facilities in the Port of Keelung. The East Passenger Center is a three-story building. The top floor is open to residents, and part of the second floor is a shopping mall. When cruise passengers go through customs clearance, the car park on the first floor becomes a restricted area to serve them. After the customs clearance is finished, the building will open to residents again (Figure 3).
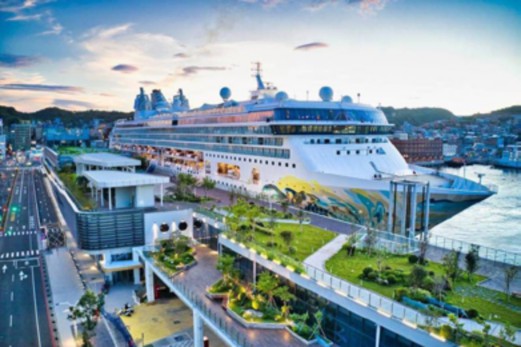
Figure 3. East passenger centre in Port of Keelung (Source: The website of TIPC)
The Port of Suao also has the same problem in order to achieve the needs of city development and port operation. They have to accommodate sightseeing activities, design facilities with tourism functions and commercial use, and improve the surrounding traffic and landscape. The preconditions are maintaining port operation energy and releasing the port area space to connect the commercial space.
Environmental quality control – Air pollution
One way of mitigating measures is to use space flexibly, where land use types can be dynamically adjusted, and reduce the gap and distance between the port and the city. Another method of mitigation is to reduce the impact of port operations on the city and reduce pollution levels through different types of regulatory operations.
For example, there are currently two air pollution control measures in port cities. One prohibits the passage of large trucks on certain roads, which are usually pass-through residential areas. The trucks are restricted to certain roads to keep away from residential areas. The other prohibits old trucks from entering the port area to reduce air pollution.
Conclusion
According to the results of this research, the interface between the port and the city is prone to competition for land use. When the city area cannot adjust the land use pattern to become a buffer zone, the land use pattern of the port area mostly changes to become a buffer zone. In addition, city areas adjacent to ports are also more susceptible to port operations and have poorer quality of life.
Therefore, when space is limited, and demand is high, port operators need to be more open and innovative in their use planning to meet the needs of all stakeholders.
Conflict of Interests
No potential conflict of interest was reported by the author.
Endnotes
This paper has been presented at the SPACE International Conference 2022 on City Planning and Urban Design.
References
AIVP. (2015). Plan the City with the Port: Guide of Good Practices. The worldwide network of port cities. Retrieved from https://www.aivp.org/wp-content/uploads/2021/01/AIVP-guide-of-good- practices-english_adherent.pdf (Last Access: 10.06.2022)
Allen, J., & Eichhorn, C. (2007). D 1.3 BESTUFS Policy and Research Recommendations III: Port cities and innovative urban freight solutions: Managing urban freight transport by companies and local authorities.
Daamen, T. (2007). Sustainable development of the European port-city interface. In ENHR- conference, Delft. June (pp. 25-28). Retrieved from https://dh1hpfqcgj2w7.cloudfront.net/media/ documents/2015.03.02_sustainable-develop-54f430ccc4b9f.pdf (Last access: 9.6.2022)
Daamen, T., & Louw, E. (2016). The challenge of the Dutch port-city interface. Tijdschrift voor economische en sociale geografie, 107(5), 642-651. https://doi.org/10.1111/tesg.12219
Daamen, T. A., & Vries, I. (2013). Governing the European port–city interface: institutional impacts on spatial projects between city and port. Journal of Transport Geography, 27, 4-13. https://doi. org/10.1016/j.jtrangeo.2012.03.013
Hein, C., & Van Mil, Y. (2019). Towards a comparative spatial analysis for port city regions based on historical geo-spatial mapping. PORTUS Plus, 9(8), 1-18. Retrieved from https://www. researchgate.net/publication/339168227_Towards_a_Comparative_Spatial_Analysis_for_Port_ City_Regions_Based_on_Historical_Geo-spatial_Mapping (Last access: 5.6.2022)
Merk, O. (2013), “The Competitiveness of Global Port-Cities: Synthesis Report”, OECD
Regional Development Working Papers, No. 2013/13, OECD Publishing, Paris. https://doi. org/10.1787/5k40hdhp6t8s-en
Ng, K. Y. A. and Pallis, A. A. (2007), Differentiation of port strategies in addressing proximity: the impact of political culture, Proceedings for the International Congress on Ports in Proximity: Competition, Cooperation and Integration, Antwerp and Rotterdam, 5-7 Dec 2007.
![]()
Notteboom, T. E. and Rodrigue, J. P. (2005), Port regionalization: towards a new phase in port development, Maritime Policy & Management, 32(3): 297 – 313. https://doi. org/10.1080/03088830500139885
![]()
Puig, M., Azarkamand, S., Wooldridge, C., Selén, V., & Darbra, R. M. (2022). Insights on the environmental management system of the European port sector. Science of the Total Environment, Volume 806, Part 2, 2022, 150550. https://doi.org/10.1016/j.scitotenv.2021.150550
Urbanyi-Popiołek, I., & Klopott, M. (2016). Container terminals and port city interface–a study of Gdynia and Gdańsk ports. Transportation Research Procedia, 16, 517-526. https://doi.org/10.1016/j. trpro.2016.11.049
Van den Berghe, K. B., & Daamen, T. A. (2020). From planning the port/city to planning the port- city: exploring the economic interface in European port cities. In European Port Cities in Transition (pp. 89-108). Springer, Cham. https://doi.org/10.1007/978-3-030-36464-9_6
Verhoeven, P., & Backx, N. (2010). Code of practice on societal integration of ports. ESPO, European Sea Ports Organization: Brussels, Belgium.